Getting Code Coverage to SonarQube
You finally managed to get your first SonarQube analysis published to the SonarQube server. You’ve been writing C# code all day and anxiously you navigate to the report to see how your initial coding is being rated. You see some minor code smells, perhaps a major issue that is being exaggerated. But the thing that really stands out is the metric below:
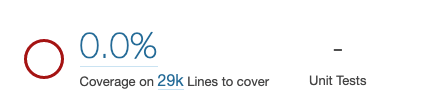
No Coverage information is being displayed, not even your unit tests are being counted. What is going on here?
Simply put, the information about your tests and the amount of code they cover isn’t being read by the SonarQube analyser that runs during your pipeline. This can have multiple causes, but first let’s zoom in on where this information is stored in the first place.

Scope of this article
SonarQube has a wide range of support for different languages and pipelines. This article specifically focuses on the following environment:
- C# / .NET project
- Azure DevOps as CI/CD platform
- YAML pipelines
- SonarQube extension installed in Azure DevOps
- Self hosted SonarQube server
Counting unit tests
Every time you run your unit tests against your code you have the option to output the result of each test into a TRX file. This is a Microsoft standard file for tests written in .NET. This can be done by attaching the TRX logger to your testrun.
dotnet test WouterCompiles.sln --logger trx
For each test project the test outcomes are saved into a single TRX file, often in the project directory itself. Inside a TRX file the outcome of the individual tests can be read, but also other basic information like duration, name, category etc.
TRX files don’t contain information about the production code that is being covered for each test. Think of it as the information you can see in the Test Explorer in Visual Studio. TRX files can be opened independently in Visual Studio without the original test code being required.
SonarQube uses TRX files to count the amount of unit tests that have been executed against your code. Although often you can let SonarQube scan your test code as well, it doesn’t use it to count the unit tests themselves.
Measuring Code Coverage
With your production code and TRX files alone you can’t yet determine the Code Coverage.
SonarQube however doesn’t calculate this afterwards, this has to be done upfront during the execution of the unit tests themselves. This can be done by again configuring the test run to also perform a Code Coverage analysis.
dotnet test WouterCompiles.sln --collect "Code Coverage"
Code Coverage information can be outputted into different formats. In my experience, using the XML format I’m always sure that SonarQube will be able to interpret the information. More about this below when I talk about configuring your pipeline. To use the XML format append the following to your dotnet test command.
dotnet test WouterCompiles.sln --collect "Code Coverage;Format=Xml"
You’ve got Coverage yet?
With the above steps you have all the test information required to get the SonarQube metrics updated. Yet, often it still won’t show up after starting the build pipeline again. Why?
There is probably still a mismatch in where SonarQube is trying to look for the files, and where the build and test commands are storing the TRX and Coverage files.
Configuring the CI pipeline
The last hurdle is fine-tuning your pipeline so that SonarQube will find all the metric files that you have just created. Following the documentation of SonarQube itself, the pipeline can look something like this:
- task: SonarQubePrepare@5
  displayName: SonarQube prepare
  inputs:
    SonarQube: 'SonarQubeServiceConnection'
    scannerMode: 'MSBuild'
    projectKey: woutercompiles.it

- task: DotNetCoreCLI@2
  displayName: 'Build'
  inputs:
    command: 'build'
    projects: '**/*.sln'
    arguments: '--no-restore -c Release'

- task: DotNetCoreCLI@2
  displayName: 'Test'
  inputs:
    command: 'test'
    projects: '**/*.sln'
    arguments: '--no-build -c Release'
    publishTestResults: true

- task: SonarQubeAnalyze@5
  displayName: SonarQube start analyse

- task: SonarQubePublish@5
  displayName: SonarQube publish analyse
  inputs:
    pollingTimeoutSec: '300'
Nothing wrong with this at first glance, SonarQube is being prepared, the code is being compiled, tested and finally SonarQube can scan and process the results.
Besides publishing your test results to SonarQube, you probably are already publishing the outcomes to Azure DevOps as well. When a unit test fails, the quickest way to get feedback is by navigating to Azure DevOps. However, this exact feature is where often the problem lies.
When reading the documentation of the DotNetCoreCLI@2 task we can read the following important detail of publishing the test results to Azure DevOps:
“Enabling this option will generate a test results TRX file in
$(Agent.TempDirectory)”
Now this is interesting, when running the dotnet test command locally the TRX and Coverage files are stored at project level, but when using the DotNetCoreCLI task they can be put into a temporary directory. That explains why SonarQube, which will only look at the source directory, is not reading these files. Besides, the task already takes care of generating TRX files for us, so we don’t have to include that in our arguments.
There are two things we can do, either stop publishing to Azure DevOps and make sure the files are present in the source directory. Or we point SonarQube in the right direction and make a reference to the (unique) temporary directory. Personally I would like to keep using both features so pointing SonarQube to the right folder makes sense. Luckily SonarQube has just the sonar property settings we need:
sonar.cs.vstest.reportsPaths=$(Agent.TempDirectory)/**/*.trx
sonar.cs.vscoveragexml.reportsPaths=$(Agent.TempDirectory)/**/*.xml
Using these in the SonarQube preparation step will make sure that SonarQube will notice these files. This can be confirmed by looking at the logs of SonarQube during analysis.
INFO: Adding this code coverage report to the cache for later reuse: /azp/_work/_temp/_376750b5e2a9_2023-02-17_15_12_50/In/376750b5e2a9/_376750b5e2a9_2023-02-17.15_12_44.xml

...

INFO: Parsing the Visual Studio Test Results file '/azp/_work/_temp/_376750b5e2a9_2023-02-17_15_12_31.trx'.
And now we can finally see our Coverage Metric in the SonarQube server

Our final YAML pipeline file now looks like this:
- task: SonarQubePrepare@5
  displayName: SonarQube prepare
  inputs:
    SonarQube: 'SonarQubeServiceConnection'
    scannerMode: 'MSBuild'
    projectKey: woutercompiles.it
    extraproperties: |
      sonar.cs.vstest.reportsPaths=$(Agent.TempDirectory)/**/*.trx
      sonar.cs.vscoveragexml.reportsPaths=$(Agent.TempDirectory)/**/*.xml

- task: DotNetCoreCLI@2
  displayName: 'Build'
  inputs:
    command: 'build'
    projects: '**/*.sln'
    arguments: '--no-restore -c Release'

- task: DotNetCoreCLI@2
  displayName: 'Test'
  inputs:
    command: 'test'
    projects: '**/*.sln'
    arguments: '--no-build -c Release --collect "Code Coverage;Format=Xml"'
    publishTestResults: true

- task: SonarQubeAnalyze@5
  displayName: SonarQube start analyse

- task: SonarQubePublish@5
  displayName: SonarQube publish analyse
  inputs:
    pollingTimeoutSec: '300'
Conclusion
With some minor tweaks of your existing Continuous Integration pipeline in Azure DevOps you are able to get more accurate reporting from SonarQube. Helping you and your team to make the right choices when it comes to technical debt and testing. I hope this article helps you and others. Please leave your feedback or suggestions in the comments below.